GPON Management: Adding Features to Improve Network Control
Extended the existing platform with additional functionalities to improve network monitoring and control.

Project Overview
GPON Management is a tool that helps monitor and manage fiber internet networks. It tracks the process from ordering and installation to checking network devices, making it easier for providers to deliver fast and reliable internet to users.

Project Duration
5 month

My Role
Sole Product Designer

Tools
Figma, Invision
Background
I worked as the sole UX/UI designer, collaborating closely with network engineers, the OSS team, and the project manager to introduce new features to the existing GPON Management platform. My role centered on enhancing network visibility and control by adding functional improvements, all while maintaining a consistent and user-friendly interface.
Challenges
When I joined, the project faced several UX challenges, including a lack of user research, missing documentation, no design system, unclear user flows, an incomplete site map, and undefined user personas.

Key Goals
The key goal is to help internet providers monitor and manage fiber networks efficiently, ensuring users get fast and reliable internet, while also addressing user experience challenges.

My Progress
Enhance Existing Features and Design
Improved current features by refining visuals and interactions to make them more intuitive and user-friendly.
Fill the UX Problems
Identified usability issues and pain points, then redesigned workflows and interfaces to solve them effectively.
Make the Design That Focuses on User Needs
Prioritized user research and feedback to create designs that truly address users’ goals and challenges.
Collaborate Across Multiple Departments
Worked closely with engineers, product managers, and other teams to align designs with technical constraints and business objectives.
Consistency Between Multiple Products
Ensured a unified user experience and brand identity across different products by applying standardized design principles and components.
User Research With the engineering team & OSS team
Designing for Clarity in a Complex System
I worked closely with the engineering and OSS teams to understand how they work, what they need, and the challenges they face. This helped me learn the full networking process and how data flows through the system.
One of the main challenges was making complex data easy to understand. I designed clear data tables and visual flows that showed how information moves between different parts of the network. I shared early versions with the team and improved them based on their feedback to make sure the design matched their real needs.Here’s what I learned through the process.

Understand the networking process
OSS Flow and their data
Engineering Flow and their data
Features that they want
Understand the mapping of the network and their flow
Current Limitations & Data Flow between Departments

*** The sitemap was provided by my manager, and I used it as a foundation to better understand the overall structure and user flow of the system. ***


The first rollout
We soft-launched the dashboard—with new features like a simplified device status table, error logs, and cross-portal data tracking—to a small group of internal users. Early feedback was positive about improved navigation and easier-to-read tables, especially during busy troubleshooting periods.
However, network engineers noted that the dashboard didn’t fully reflect the complexity of their processes, and some important details were missing. This feedback helped us realize the need to deepen our understanding of their workflows and iterate the design to better match their real-world needs.
Iterate, iterate , iterate
After the soft launch, we held follow-up meetings with the network and OSS teams to dive deeper into their workflows and pain points. These discussions informed refinements that made the dashboard more aligned with real daily needs, resulting in improved usability. This marked the final MVP version of the product.


Data tables that track status and show step-by-step information flow across each department, making complex processes easy to follow
Editing Data table
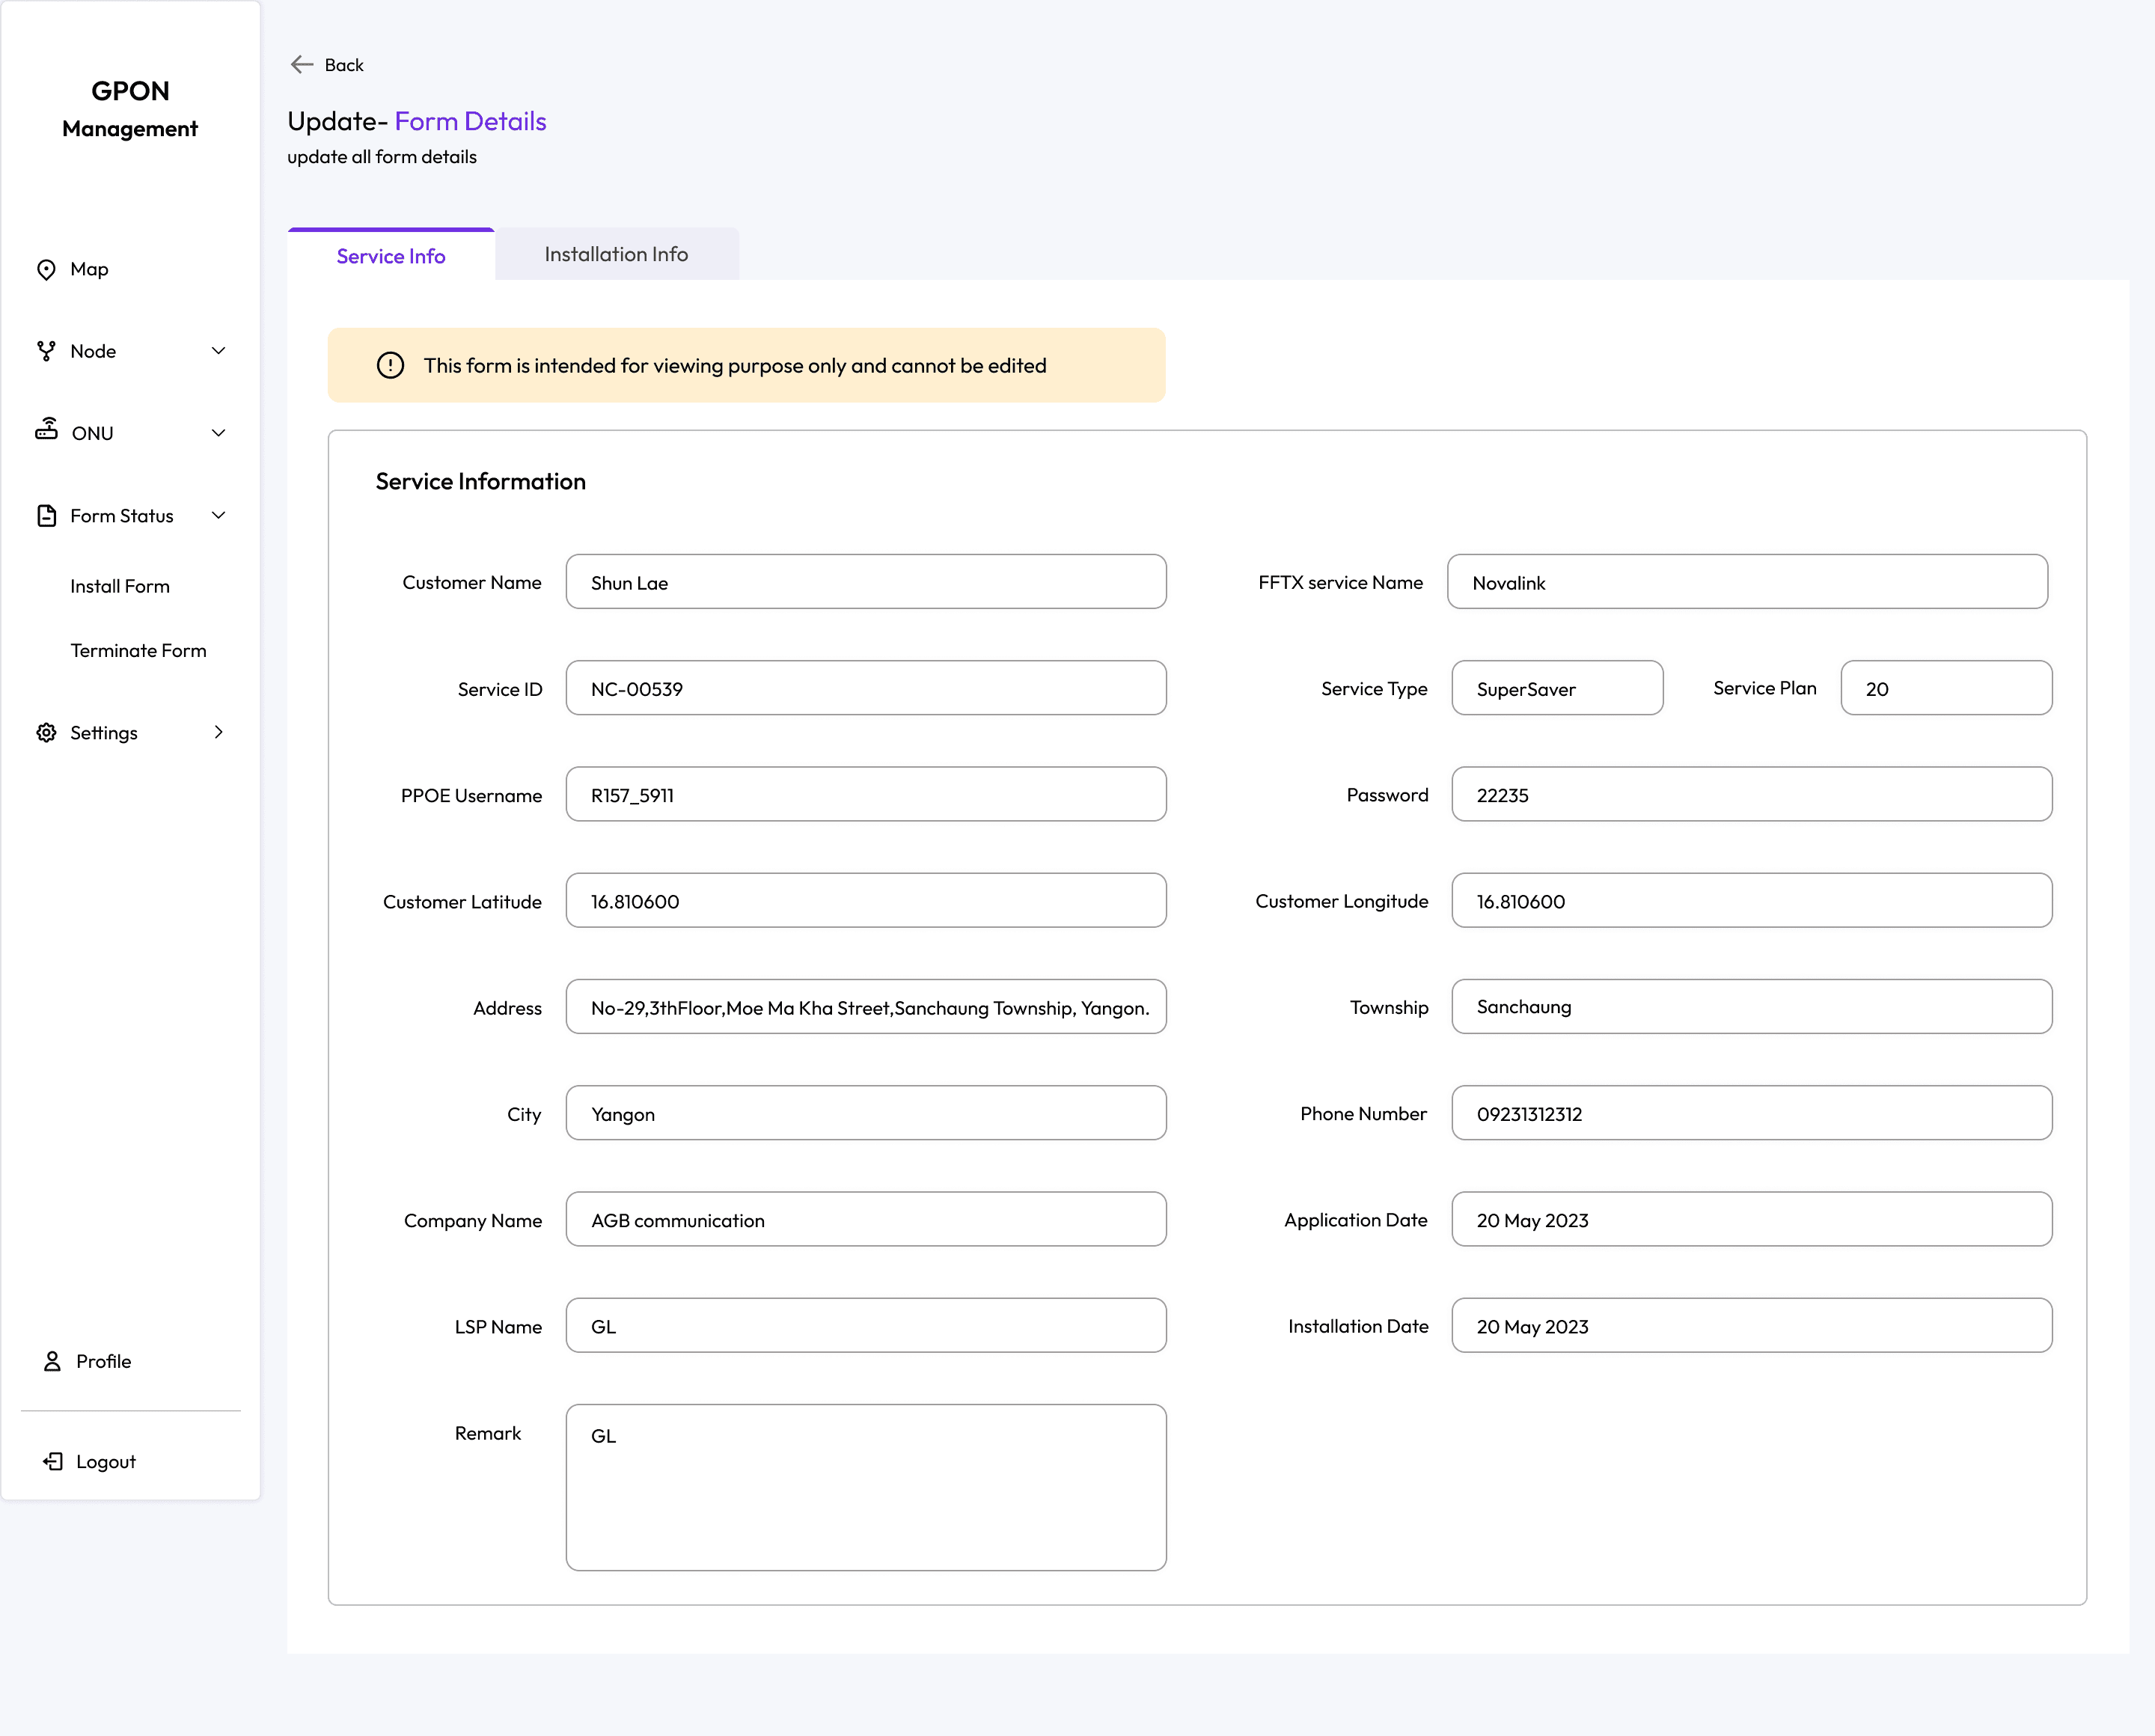
To support efficient data management across teams, we introduced two key interface components—Service Info and Installation Info cards.
Service Info allows network engineers to access and review technical details provided by other departments, helping them monitor service-related data in one place.
Installation Info is used to input and assign essential network setup details such as node codes, ONU identifiers, and other installation-specific data. This information is then shared across portals to ensure all departments are aligned during setup and activation.
These cards were designed to simplify communication, reduce data gaps, and streamline collaboration across the entire fiber network management process.

Rest of the design
These are additional designs I worked on as part of the GPON Management platform at AGB Communication


What i have learnt from doing this project
Clarify the Project Scope Early: At first, the project felt overwhelming. I realized that understanding what’s feasible from the start is key to focusing design efforts effectively.
Collaboration Is Essential: Regular communication with the project manager, developers, and users helped me understand technical limitations, align expectations, and ensure a smoother design process.
Feedback-Driven Design: Listening to feedback early on helped me identify what needed immediate changes and what could be improved later. It kept the design user-centered and allowed for continuous improvement.
Thank You For Reading !!